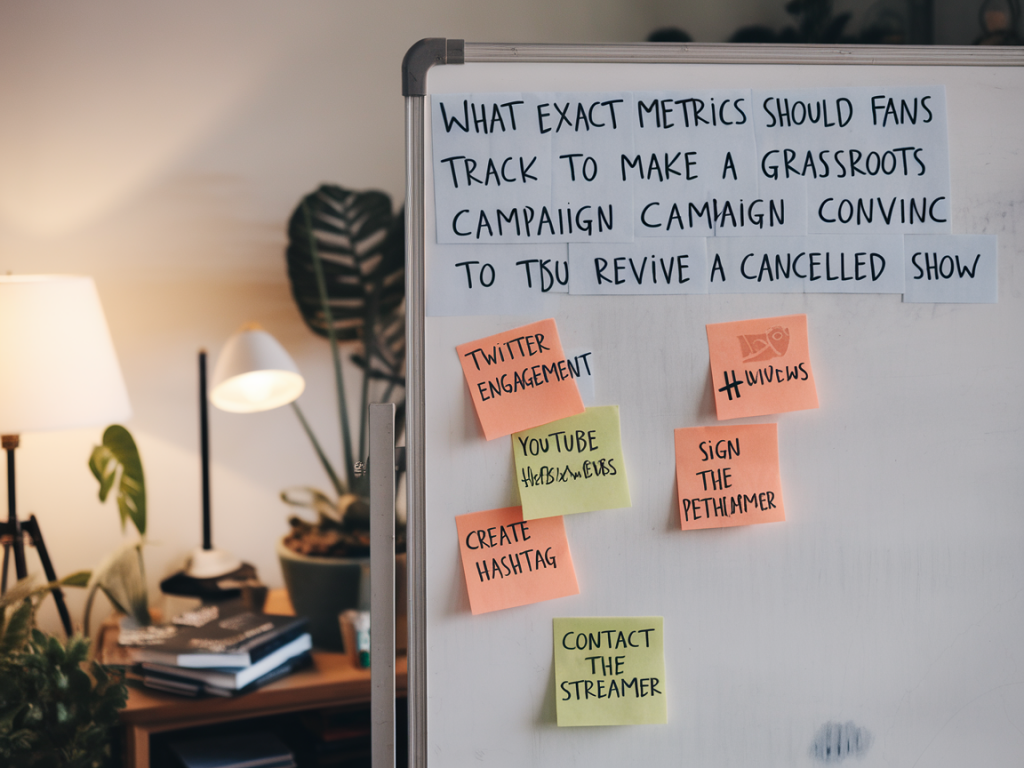
I’ve seen more than a few cancelled shows claw their way back into life because fans didn’t just *wish* — they organized, measured, and presented a convincing business case to the people who hold the checkbooks. If you want a streamer to seriously consider reviving a cancelled show, emotion alone won’t cut it. Streamers need data that ties fandom energy to measurable revenue or audience behaviour. Below I lay out the exact metrics I track (and recommend fans track) to build a compelling, business-focused campaign.
Why metrics matter — and what executives actually care about
When I talk to folks inside the industry, they always come back to one thing: predictability. Streamers want to know a revived show will bring viewers and keep them engaged. That translates into a handful of operational KPIs: new subscribers, retention, view time, acquisition cost, and ancillary revenue (merch, licensing). Your job as a grassroots campaign is to measure proxies for those KPIs — and show momentum.
Core metrics every campaign should gather
Below are the non-negotiable metrics I recommend collecting. For each one I note where to find the data, why it matters, and how to present it to a streamer.
- Search demand (Google Trends, YouTube search volume) — Shows organic interest spikes. Export weekly trends for the show title + key phrases (e.g., “Bring Back [Show]”, “[Show] season 2”). Present a chart showing sustained or growing search volume versus a control (similar cancelled show that didn’t get revived).
- Social mentions & sentiment — Track total mentions, hashtag usage, and sentiment analysis across Twitter/X, Instagram, TikTok, and Reddit. Tools like Brandwatch, Meltwater, or free Twitter/X/TikTok pulls can help. Streamers care about positive sentiment combined with scale.
- Hashtag campaign performance — Number of unique users tweeting/posting with campaign hashtag, impressions, and top influencers using it. Highlight celebrity or major creator amplification — those retweets matter.
- Streaming demand proxies (watchlist adds, searches on platform) — Some platforms display “add to watchlist” counts or “most searched” lists via public APIs; others don’t. Use third-party services like JustWatch or Reelgood to estimate platform demand and tracking of “save” behaviour.
- Completion rate & binge indicators (where available) — If you can show that viewers who start the show finish episodes/series (via public data like IMDb episode ratings consistency or anecdotal survey results), it supports the “sticky” argument.
- Google Play/App Store / Prime Video reviews and ratings — Ratings are public, and spikes in positive reviews are useful evidence of regained goodwill.
- Fan engagement metrics (comments, fanart, AMAs, cosplay) — Volume of fan content across platforms, YouTube reaction video views, and engagement on TikTok trends. These demonstrate long-tail engagement potential and organic marketing value.
- Petitions and signatures — Not just raw numbers, but verified unique signers, geographic spread (are they in target markets?), and email capture rate. Highlight any high-quality endorsements (actors, creators, critics).
- Crowdfunding / Pre-orders / Merch sales — Money talks. Any revenue generated via crowdfunding (Kickstarter/Pledge), pre-orders of a revival-themed product, or a surge in existing official merch sales proves monetizable demand.
- Viewer acquisition cost proxies — Estimate how many new subscribers you could bring relative to campaign cost. Show comparative CAC for similar IP revivals if possible.
How to collect reliable data (tools and tactics)
I always recommend a mix of public tools and campaign-owned data. Here’s a practical toolset that’s accessible to most fan groups:
- Google Trends (search interest over time)
- Social listening: TweetDeck + Brand24 / Hootsuite for volume; free sentiment via MonkeyLearn or simple manual sampling
- YouTube Analytics and TikTok analytics (for channels running campaign content)
- JustWatch / Reelgood (availability and demand signals)
- Change.org or Care2 for petitions; export signer CSVs to demonstrate geographic concentration
- Crowdfunding pages (Kickstarter/Indiegogo) and Shopify/Etsy for merch sales stats
- Surveys via Google Forms or Typeform for completion-rate estimations and viewer behaviour
How to present the data to a streamer — structure & benchmarks
Data without context is noise. I recommend packaging your findings into a one-page executive summary and a supporting dossier. The one-page should answer three questions plainly: How many potential viewers exist? How will they convert to subscribers or drive retention? What unique value does this fandom bring (earned media, low acquisition costs, cross-platform synergy)?
Include benchmarks where possible. If you can show that a similar revival (e.g., a show revived by Netflix or Amazon) brought X new subscribers or Y hours watched per episode, that’s gold. If you don’t have direct benchmarks, use industry proxies: average watch time per subscriber on platform Z, or average new subscriber lift from a limited marketing campaign.
Metrics table: what to show, why, and sample target
| Metric | Why it matters | Sample target to be persuasive |
|---|---|---|
| Search interest increase | Proof of organic discovery and curiosity | 25–50% sustained lift over 3 months |
| Unique petition signers (verified) | Demonstrates mobilizable fanbase and mailing list potential | 50k+ global (or 10k+ in key markets) |
| Hashtag impressions & unique users | Scale of campaign reach and influencer amplification | 5–10M impressions; 100k+ unique participants |
| Merch / crowdfunding revenue | Direct revenue signal | $50k+ in pre-orders or crowdfunding in 30 days |
| Repeat watch / completion estimates | Indicates retention potential | Completion estimated >70% of starters (via survey) |
Storytelling: don’t just send numbers — tell the narrative
When I compile campaigns, I pair charts with human stories: quotes from superfans, creator support statements, and examples of organic viral moments (TikTok trend that generated X views). Streamers fund people-driven content. Show that the fandom can generate free marketing and extend the show’s life through UGC, conventions, and merch.
Small details that make a difference
Include a suggested low-cost pilot: propose a limited-season return (6–8 episodes), a scripted special, or a co-produced spinoff. Estimate production cost vs. potential incremental subscribers using conservative conversion rates. If you can model a 3–6 month payback, execs will pay attention.
Lastly, keep your data clean. Duplicate signatures, bot-driven engagement, or inflated impressions will get your dossier tossed. Verify, document methodology, and be transparent about limits.
Bring me your raw numbers and I’ll help you frame them — but start today: pick the metrics above, assign owners in your fan group, and report weekly. With the right mix of passion and proof, you can change a streamer’s risk calculation and get your show another shot at life.